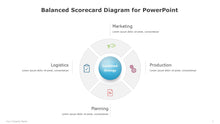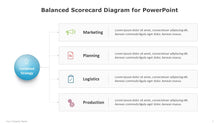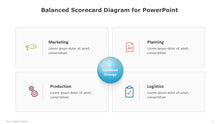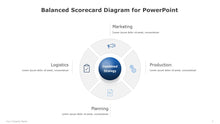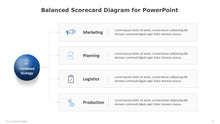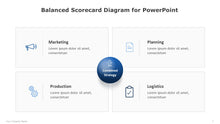
In business, a balanced scorecard (BSC) is a tool used to assess the success of a particular activity in relation to a company's strategic goals. Balanced scorecards are used during strategic planning to analyze if a specific strategy created within a department or company will fit with the macro goals of an organization.
In a classic balanced scorecard, a firm's actions are examined from four multiple viewpoints: financial, learning & growth, business processes, and customer satisfaction and satisfaction.
For data collecting and analysis purposes, these actions are categorized and labeled in the proper buckets based on the given metrics, goals, and objectives. The activities may then be adequately reviewed and appraised as a result.
You can use this Balanced Scorecard Diagram Template for PowerPoint during strategic planning or when presenting your strategy to your team.
The diagram is fully editable and can be customized to fit your needs.


